
“I’m so sore even my hair hurts”
Hey there Ladies and Gents, so what’s the deal with Disability in the US?

According to the U.S. Department of Labor, 1.5 million more people in the civilian non-institutional population had a disability in 2022 than the year before. In fact, when combined with the increase from the prior year, there are 2.7 million more disabled adults now than in 2020.
According to the National Center for Education Statistics. During the 2021-22 school year, there were 7.3 million students receiving special education or related services in U.S. public schools, making up 15% of total enrolment. This figure rose yearly since 2010-11, when 6.4 million disabled students made up 13% of public school enrolment
The federal government spends more money each year on cash payments for disabled former workers than it spends on food stamps and welfare combined
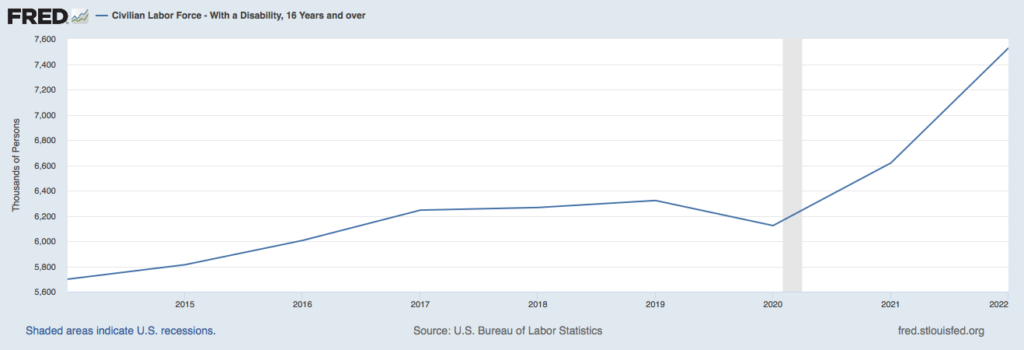
The vast majority of citizens receiving disability payments do not work; and therefore may not be appreciated in economic figures
There’s something going on
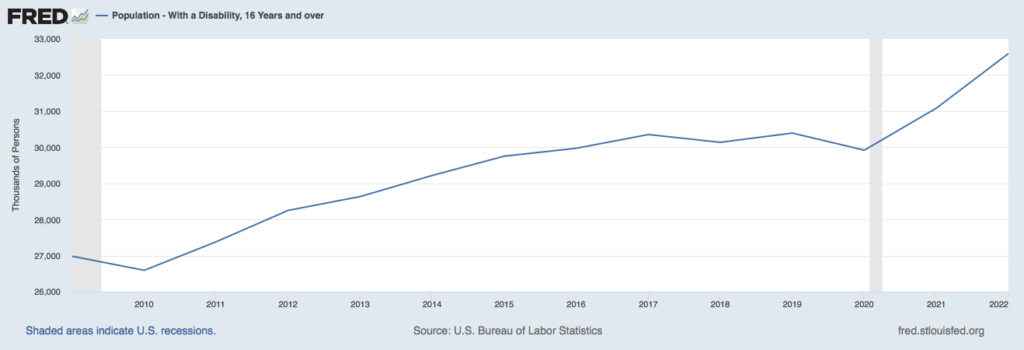
It’s estimated that nearly half of all Americans 75 and older and 1/4th of all adults have a disability (evenly distributed by race).
Okay more people have a disability but what is being done about it? Spending. Lots. of. spending.
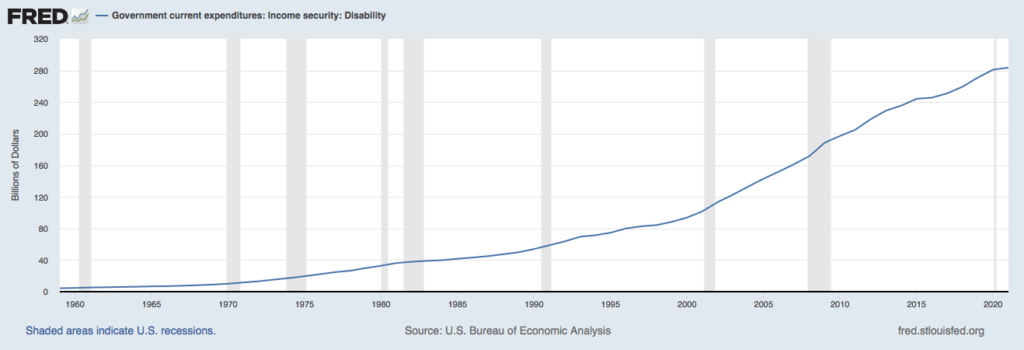
To give you some exact figures, in 1959 the expenditure on disability was 4.389 Billion Dollars. In 1971, when Nixon took the US off the gold standard, the number was at 11.631 Billion. In 2008, during the great financial crisis during the real estate collapse this number was at 171.742 Billion to now where dated till 2021 it is now at 283.641 Billion.
Well, 1959 you say, that’s a long time ago, what about population increase? what about inflation?
From 1959 to 2021 (175,818,000 to 331,992,000) the population has increased 88.82% (current legal population now at 335M but 2021 was used for comparison purposes). Let’s look at inflation: If we look at the 1959 expediture of 4.389B and seek to find out what that would be worth in 2021, we would see it’s value would be 40.868B dollars. A staggering 831.2% cumulative inflation in that 62 year period. But hang on… 40.868 Billion, what was spent in 2021 on disability? 283.641 Billion!
Even if you multiple the population increase and the new inflation number it takes you to 77.166B. This means that even after factoring in these changes, disability spending has still increased by 367.5%!!!!
I have a relative who travels to the USA once every 2 years–long enough to be away for some time to notice changes–and every time they return they see more and more in motorized wheelchairs just to get around.
I didn’t even know, but there’s even a Disability Pride Month in the United States.
According to the US Government,”Disability Pride Month is celebrated every July and is an opportunity to honour the history, achievements, experiences, and struggles of the disability community“. I guess with almost a majority of your population disabled, it makes sense to give them a month.
There may be two matters going on here. Either the introduction of a new medical technology and diagnostic criteria has created a number of (un)intended consequences and/or people are feeling the brink of the cost of living and they are absolutely begging Uncle Sam for support–and he likes it like that. Either way, there’s a spending problem on one side and a sickness/reliance on the government problem on the other side.

People often beat their chests about “standing up to their government” but the reality is that they need the government to stand up!
#StayOnTheBall